In 2025, Staff Augmentation has truly evolved from an emergency measure or last resort to a strategic lever for rapidly scaling engineering teams at a reasonable cost. Whether you’re a CTO of a startup, a high-growth tech company, or a large enterprise, hiring augmented staff in any of the three flavors of onshore, nearshore, or offshore has now become part of delivering and building agile tech teams.
But there’s a problem. You cannot improve what you do not measure.
The Situation
Most CTOs enter staff augmentation aggressively without a key performance management system for tracking performance. Resulting in:
- A lack of visibility into the effectiveness of the augmented talent
- Challenges to align remote and augmented teams with core business objectives, goals, and organizational vision.
- Cost, time, or budget overruns or both
- Delivers poor quality output.
Foster the Pain Point
Even with the best staff augmentation on paper, without data-driven KPIs, your augmented team becomes a black box. That’s a risk, not just for product timelines, but for long-term scalability. In 2025, when tech speed = market success, there’s no room for guessing.
The Solution – Staff Augmentation
For Staff Augmentation, append CTOS needs visibility into the right KPIs – KPIs that are not vanity metrics, but revolve around ’ real’ delivery, productivity, collaboration, and cost efficiency.
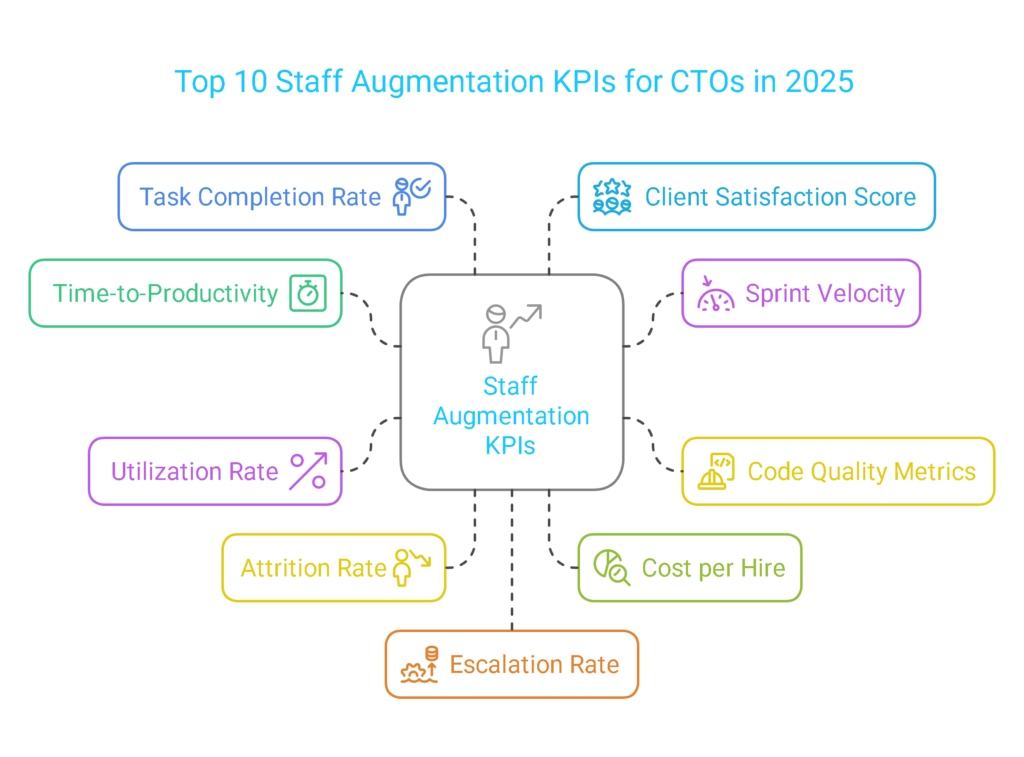
Let’s take a closer look at the Top 10 Staff Augmentation KPIs that every CTO should review in 2025.
1. Time-to-Productivity (TTP)
Definition: The amount of time it takes for a newly augmented employee to become fully productive.
Why It Matters:
Long ramp times hinder agility. A short Time-To-Productivity (TTP) indicates a well-defined and effective hiring and onboarding process.
How To Measure:
- Count the days from onboarding to the time the developer is completing 80–100% of their assigned sprint tasks.
- Utilize tools such as Jira or ClickUp to track contribution timeframes.
💡 Pro Tip: If you observe a consistently high TTP, review your onboarding documentation or internal knowledge bank.
2. Sprint Velocity
Definition: The average amount of work produced by the augmented team in a sprint (usually measured in story points).
Why It Matters:
It shows how effectively your augmented developers are contributing to whatever is being delivered.
How to Measure:
Look at the sprint velocity of in-house vs augmented teams and watch for trends. If the augmented velocity seems to dip regularly, that’s a potential warning sign.
✅ Use this with TTP to look at the effects of onboarding on delivery time.
3. Code Quality Metrics
Definition: Indicators such as defect density, code review comments, and test coverage.
Why It Matters:
Cultivating a high level of output does not mean much if your code is buggy or not scalable. Tracking code quality allows you to keep your tech debt manageable.
How to Measure:
- Use SonarQube or GitHub insights
- Metrics to track: Bugs per KLOC (thousand lines of code), Unit Test Coverage, Pull Request (PR) rejection rate
📉 Red Flag: High PR rejection rates = knowledge or communication gaps.
4. Utilization Rate
Definition: Percentage of time a flexible resource is truly engaged in billable or productive work.
Why It Matters:
Low utilization = wasted spend. This KPI measures whether you’re getting ROI on two increases or you’re augmenting a hire.
How to Measure:
Total billable hours ÷ Total available hours × 100
🎯 Target 75–85% utilization to maximize output while avoiding burnout.
5. Attrition Rate
Definition: Percentage of staff augmentation resources that leave before the end of a contract, or within a specified timeframe.
Why It Matters:
High attrition creates disruptions in momentum, as well as potential costs to your company in continual rehiring and onboarding costs.
How to Measure:
Number of departures ÷ Total staff augmentation headcount × 100
🚨 Noticing a sudden increase? Review work volume distribution, culture fit, and vendor capability.
6. Cost per Hire / Per Resource
Definition: The total cost of obtaining an augmented resource.
Why It Matters:
Staff augmentation is affordable when looking only at the hourly rates, but you have to consider the hidden costs as well (i.e., recruitment costs, onboarding costs, and costs to manage).
How to Measure:
Add your costs together:
- Recruitment costs (fees and direct internal costs)
- Time cost of onboarding a new resource
- Tools and licenses for the new hire
- Divide by the number of resources you hired.
💡 It is valuable to measure this across geographies (onshore vs. nearshore vs. offshore) as it can be considered for strategic planning.
7. Task Completion Rate
Definition: The percentage of assigned tasks completed on time in a sprint or milestone.
Why it matters :
It shows productivity, accountability, and ability to meet deadlines – the three main pillars of any dev team.
How to Measure:
Completed tasks / Total assigned tasks x 100
📊 Leverage project tracking tools to automate reporting and detect downward trends early.
8. Client or Product Team Satisfaction Score
Definition: Feedback-based KPI from internal product owners, team leads, or project managers.
Why It Matters:
Quantitative metrics require qualitative input. How well do your augmented resources collaborate, communicate, and contribute?
How to Measure:
Conduct bi-monthly or quarterly feedback surveys with scoring for collaboration, communication, reliability, and initiative.
🗣️ Where one can encourage anonymous feedback to obtain genuine insights.
9. Escalation Rate
Definition: Rate of escalations (technical or operational) needing executive attention.
When to Pay Attention:
The higher the escalation rate, the poorer the decision-making autonomy, and expectations have not been aligned.
How to Measure:
Count the number of escalations per augmented team or vendor monthly.
✅ Combine it with the satisfaction score to help determine root cause as well as vendor performance.
10. Delivery Timeline Adherence
Definition: Assesses to determine whether deliverables have been completed according to the original set timelines.
Why It Matters:
Missing deadlines can cause delays in the project, increase the budget, and upset the client.
How to Measure:
Compare actual delivery times vs estimated times over 3 – 6 months.
🛠 Use baseline data to refine planning and budget estimates and prevent unrealistic estimates.
Putting It All Together: A CTO’s KPI Dashboard
Think about all of the KPIs viewed through a unified dashboard; color-coded, updated weekly, and compared to a baseline set of internal and augmented resources. That dream is a requirement by 2025.
Here is what you can put into a lean dashboard:
| KPI | Ideal Range | Frequency | Tool |
| Time to Productivity | <3 weeks | Per hire | Jira/ClickUp |
| Sprint Velocity | Stable or ↑ | Per Sprint | Jira/Azure Developers |
| Code Quality | 90% + Test Coverage | Weekly | SonarQube |
| Utilization Rate | 75 – 85% | Monthly | Time-tracking tool |
| Attrition | < 10% | Quarterly | HR Systems |
| Cost per hire | ⬇️ overtime | Per hire | HR/Finance |
| Task Completion | 90 – 95% | Per Sprint | ClickUp/Monday |
| Sastisfaction | 8+/10 | Quarterly | Custom Survey |
| Escalation | <5/month | Monthly | Project Reports |
| Timeline Adherence | 90 – 100% | Monthly | PM Software |
Final Thoughts: Why These KPIs Matter in 2025
The days of chief technology officers experimenting with large teams are over. The future of technology leadership is about metrics. Identifying and tracking your KPIs allows you to see staff augmentation as more than a fill-in, but as a realization of your extended team.
Keeping an eye on staff augmentation KPIs allows you to:
- Reduce your risk
- Accelerate delivery
- Enhance collaboration
- Engineer the max ROI from every resource
Want an efficient & intuitive dashboard to help you track the KPIs associated with your own augmented team? Let’s chat. We are Codepaper Technologies, and we can help you track the right metrics and manage your remote team to make the most of your implementation.
Frequently Asked Questions (FAQs)
1. What are KPIs in staff augmentation?
KPIs, or Key Performance Indicators, in staff augmentation are measurable metrics used by CTOs and project managers to assess the effectiveness, efficiency, and ROI of augmented teams. Common examples of KPIs are Time-to-Productivity, Sprint Velocity, Code Quality, and Task Completion Rates.
2. Why are Staff Augmentation KPIs important to CTOs?
Staff Augmentation KPIs provide data-driven insights to CTOs into team performance, productivity, quality, and cost efficiency. By tracking KPIs, CTOs can make informed decisions, better allocate resources, and ensure that remote or external developers are on target with business goals.
3. How do I track the performance of augmented staff?
You can track their performance by using Jira for sprint metrics, SonarQube for code quality, and time-tracking or HR software for staff utilization and attrition. You can also measure qualitative and quantitative results through regular reviews/performance dashboards and feedback surveys.
4. What is the ideal time-to-productivity for augmented developers?
The ideal time-to-productivity for augmented developers is within 2–3 weeks. This time frame would indicate your organization has a speedy onboarding process, clear documentation, and that your augmented team is smoothly integrating into the core team. Anything longer than 3 weeks might suggest that there are process or communication challenges at play.
5. Can KPI tracking improve ROI from staff augmentation?
Certainly. By measuring KPIs such as utilization rate, cost per hire, and task completion, CTOs can spot inefficiencies, change resource allocations, and improve team performance that ultimately leads to better return on investment from their staff augmentation strategy.
